


Misleading Candlestick Wicks
Body of the candle matters. Linearity = Follow through.

First understand the term linearity and what I mean by that. The term linearity means to know the smoothness of the stock in terms of how the stock moves whenever there is range expansion and let’s say it’s a characteristic of a stock and seeing this it helps to know how favourable the stock is for swing trading. Examples of what I call linear stocks.

Many or most of the traders, if they have to choose a stock one over other or let’s say at the time of prioritizing, they do it in terms of linearity of stock and the linearity is mostly quantified by their wicks that is more the wicks in the stock then they define it as choppy and less it is better it is.
Also remember the wild wicks that are big wicks where they form is also a matter of concern in stocks overall linearity. Like say at turnover of the stock but this thing can’t be quantified and hard to say if its good or bad. So, let’s just say it’s useless info for swing trading at least hence don't even think about it.
However, wicks as overall is misleading. To understand it, let's take an example of a stock, COROMANDEL. Here if you see and try to quantify or let’s say if I ask you is this linear stock? You might say this is not linear or you may say it’s not that linear compared to above examples.

Now if the same stock with the same time scale with little adjustment to price scale even this looks linear stock and feels better to some extent.
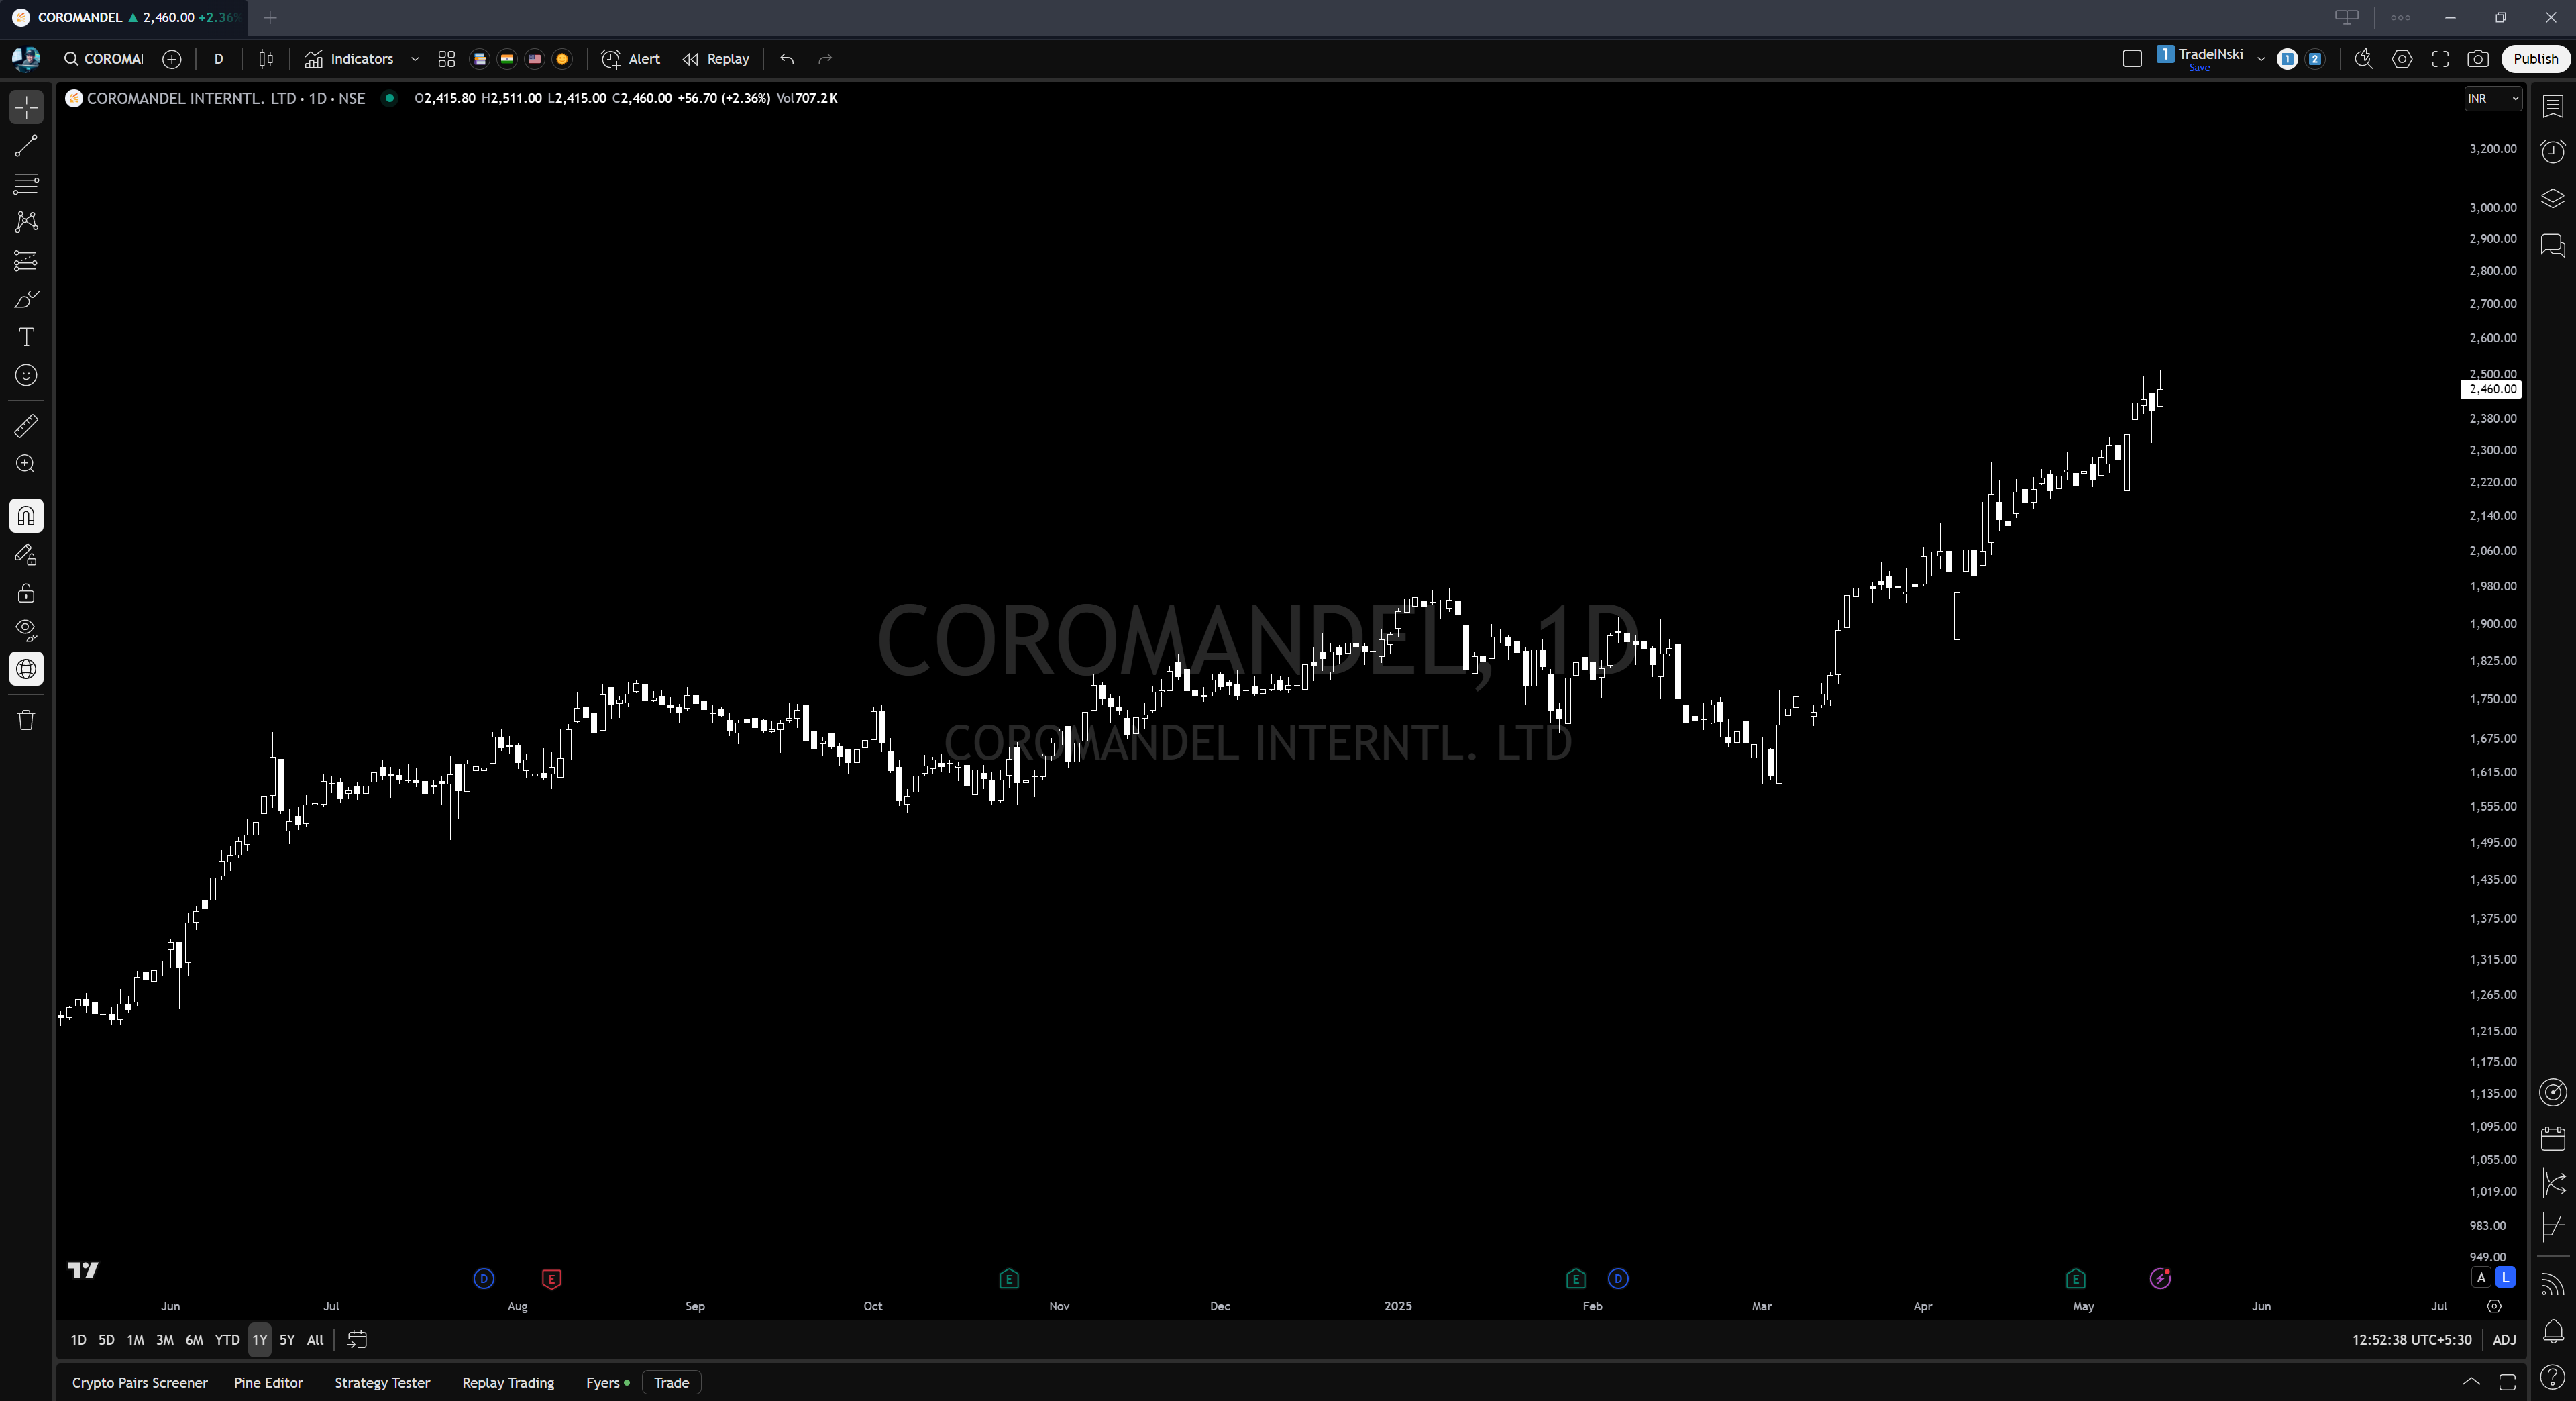
So, based on the observation if you see and going by the looks of wick for deciding linearity, then it’s a wrong idea as it depends on lot of other factors also which you have might have overlooked like the size of the screen, how much zoom in or out you are and to some extent how far you sit from screen etc. This might sound cliche, but this is what I think and to have optimal performance in trading you should have consistent charting.
For consistent charting there are a few settings I would suggest you change in your Tradingview immediately.
Scale modes (A and L) - Always visible.
A L covered with blue color is shown on the price scale as shown in the last image.
Try to keep them on always.
Right Margins - Play around and see what suits you. For my screen size and my purpose, 35 is best.
This shifts your whole chart to the left side based on bars.
Slowly increase you will know what is happening.
Always see charts in 1Y time period. As shown in the last image.


Summary,
To increase odds of success of stock working or prioritizing use linearity as a filter.
When you say linearity, it should be based on follow through of the stock does not wick which intern means based on the body of the candles.
Wicks are misleading not always but most of the time.
It is always better to have consistent charting so use A L thing and 1 Yr thing in Tradingview.
Thanks 👌