

Volume Indicator is Useless
Volume is only for liquidity and nothing else in my trading. Indicator on my chart is just for esthetics nothing else.

First let's understand why I use volume, that is only for liquidity and nothing else and for it I do volume*price (VP). Why not last 10 days or 50 days is because I think like, If I am buying stock, any stock today I need liquidity today, I don't care what was liquidity yesterday or 1 week back or 50 days back. Indirectly saying old data is irrelevant for me, as I am buying today for me what is happening today is all that matters. Here you might argue that if all there is a breakout, then for sure volume will be on that specific day. So, if that day's volume is coming then ask yourself, is it good or bad or is it against you or in favor. I feel it's in our favor because any high-volume grabs attention and as my SL are below 2% and SL hits are 99% of the entry day itself so it's never a problem to get out.
And that does not mean you trade stocks that have like 5 Cr or 10 Cr VP. I look for 20 Cr and above. Two guys with 25L positions can move the stock 10% if its VP is 5Cr which you don't want.
Now let's understand how other so-called traders use or let's say how you use it. For example, to gauge buyers’ strength and sellers’ exhaustion and moreover to prioritize stocks over others. What I mean by buyers' strength and sellers' exhaustion is mentioned below.
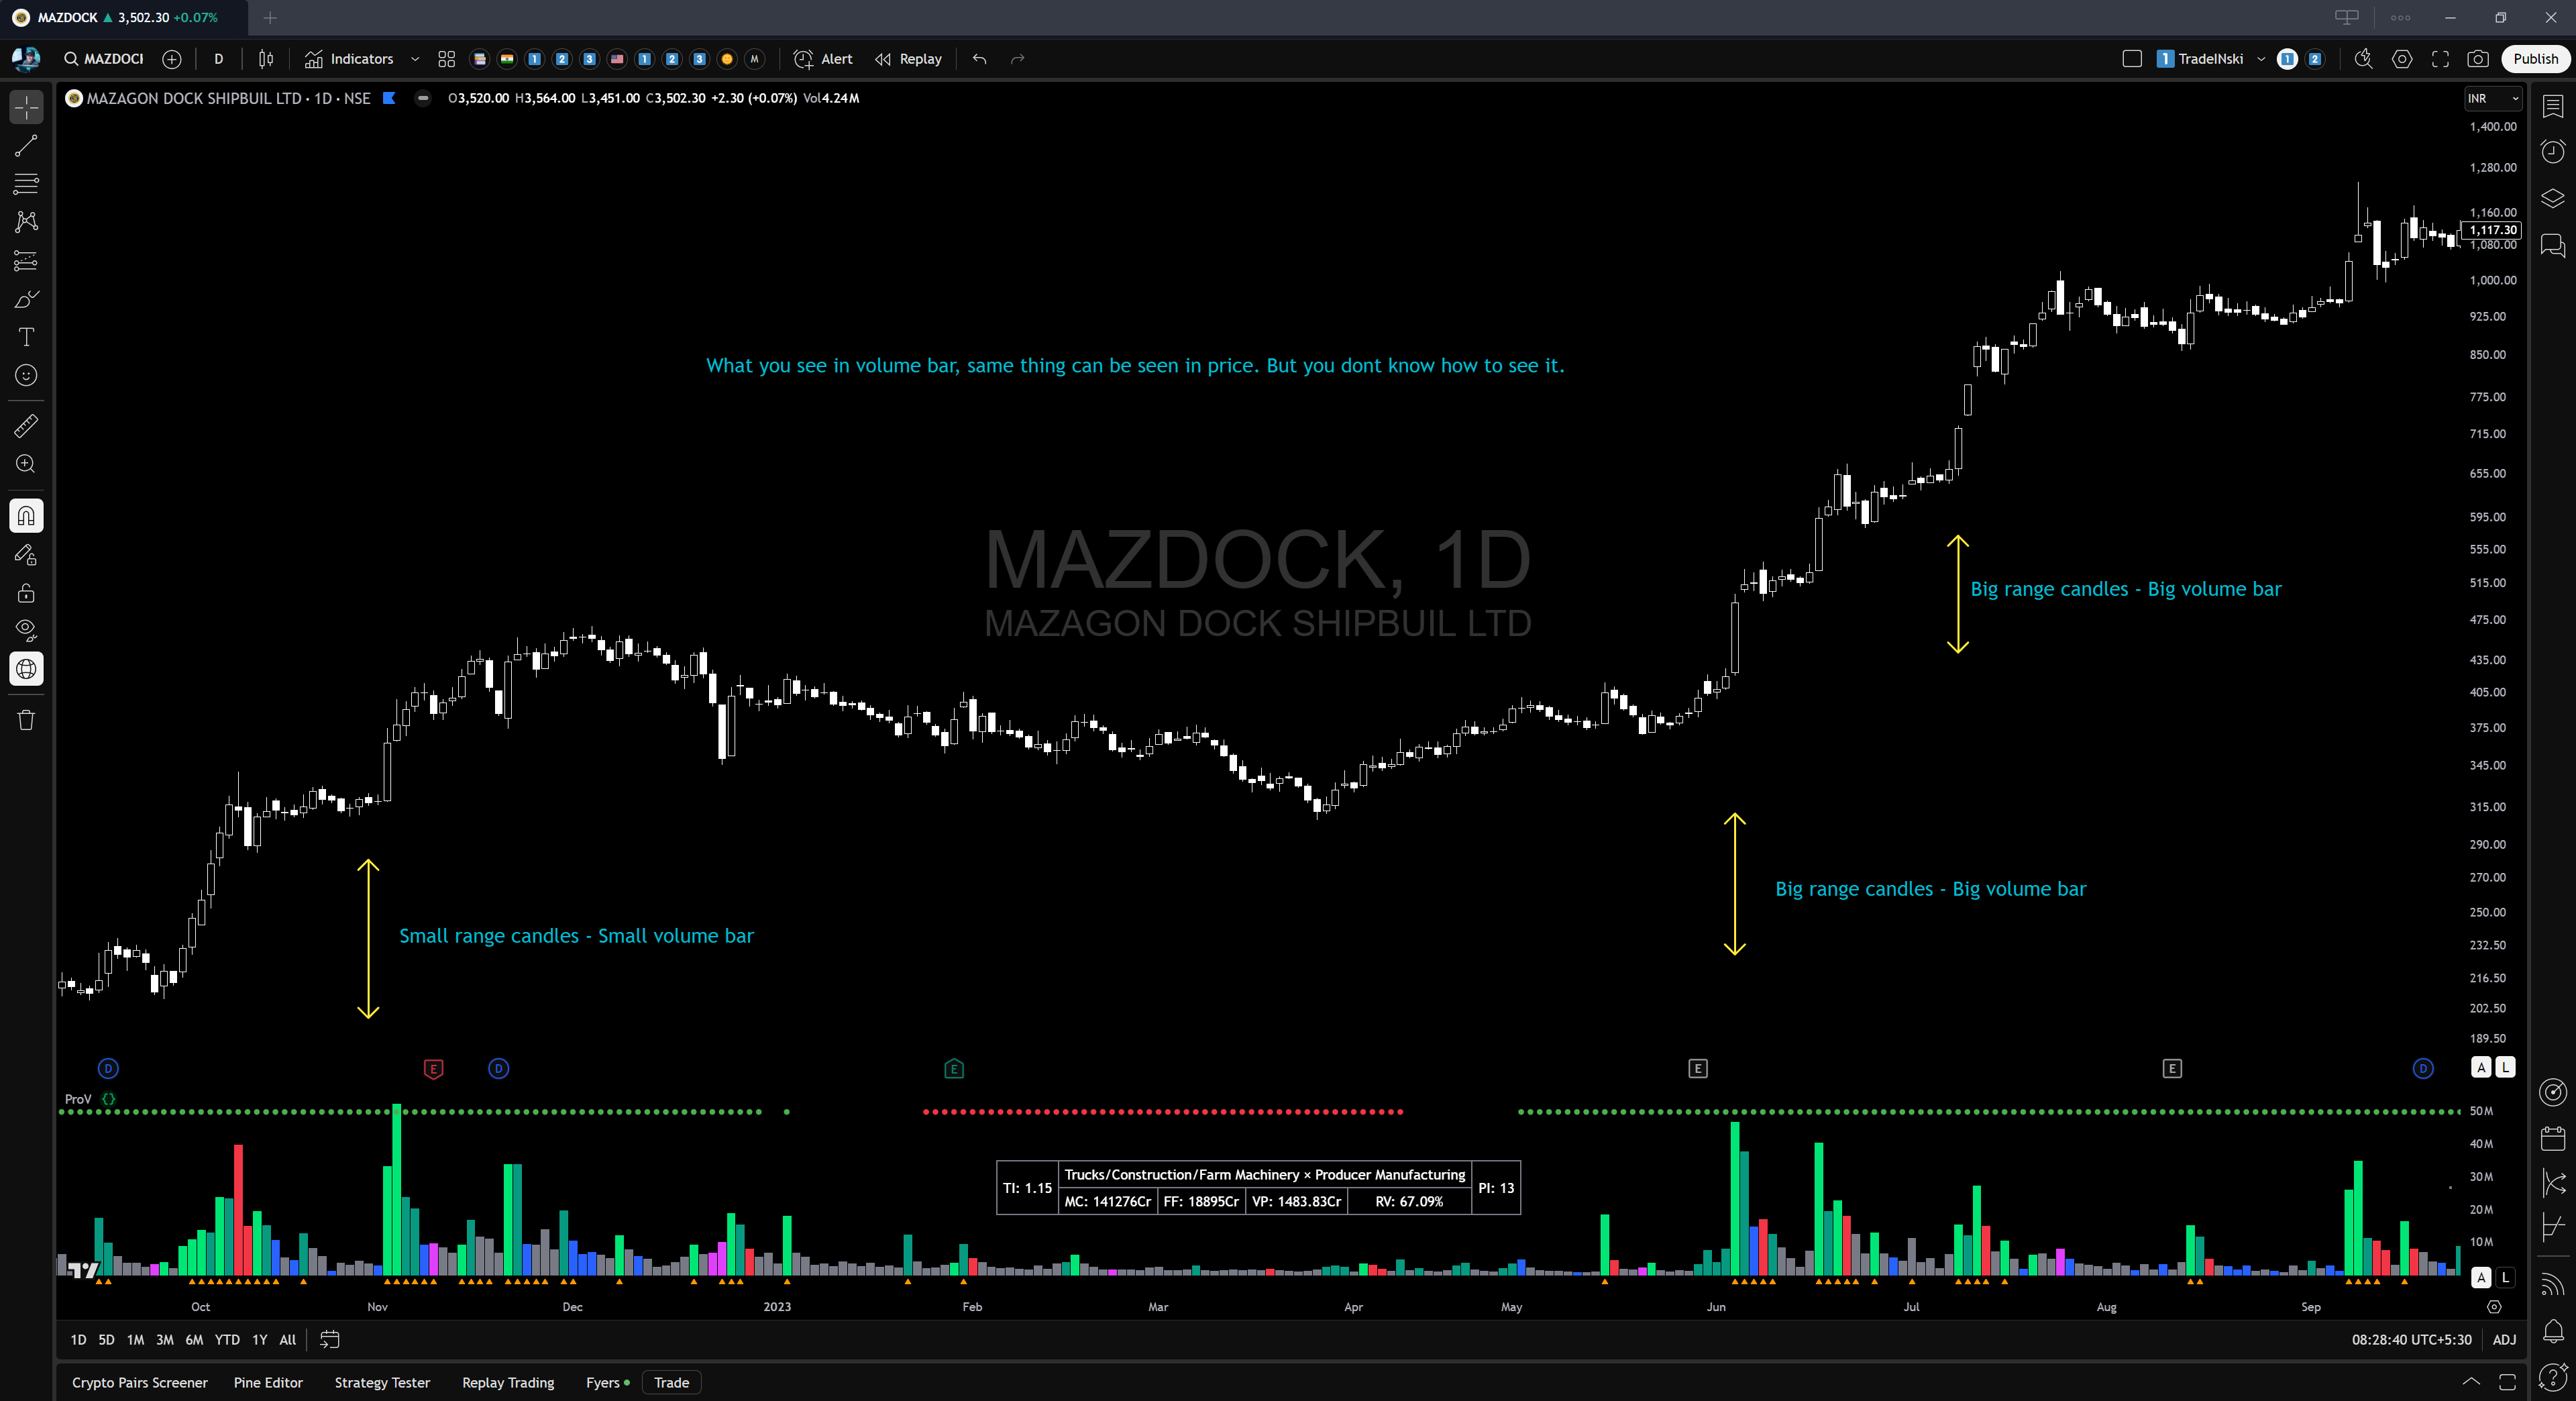
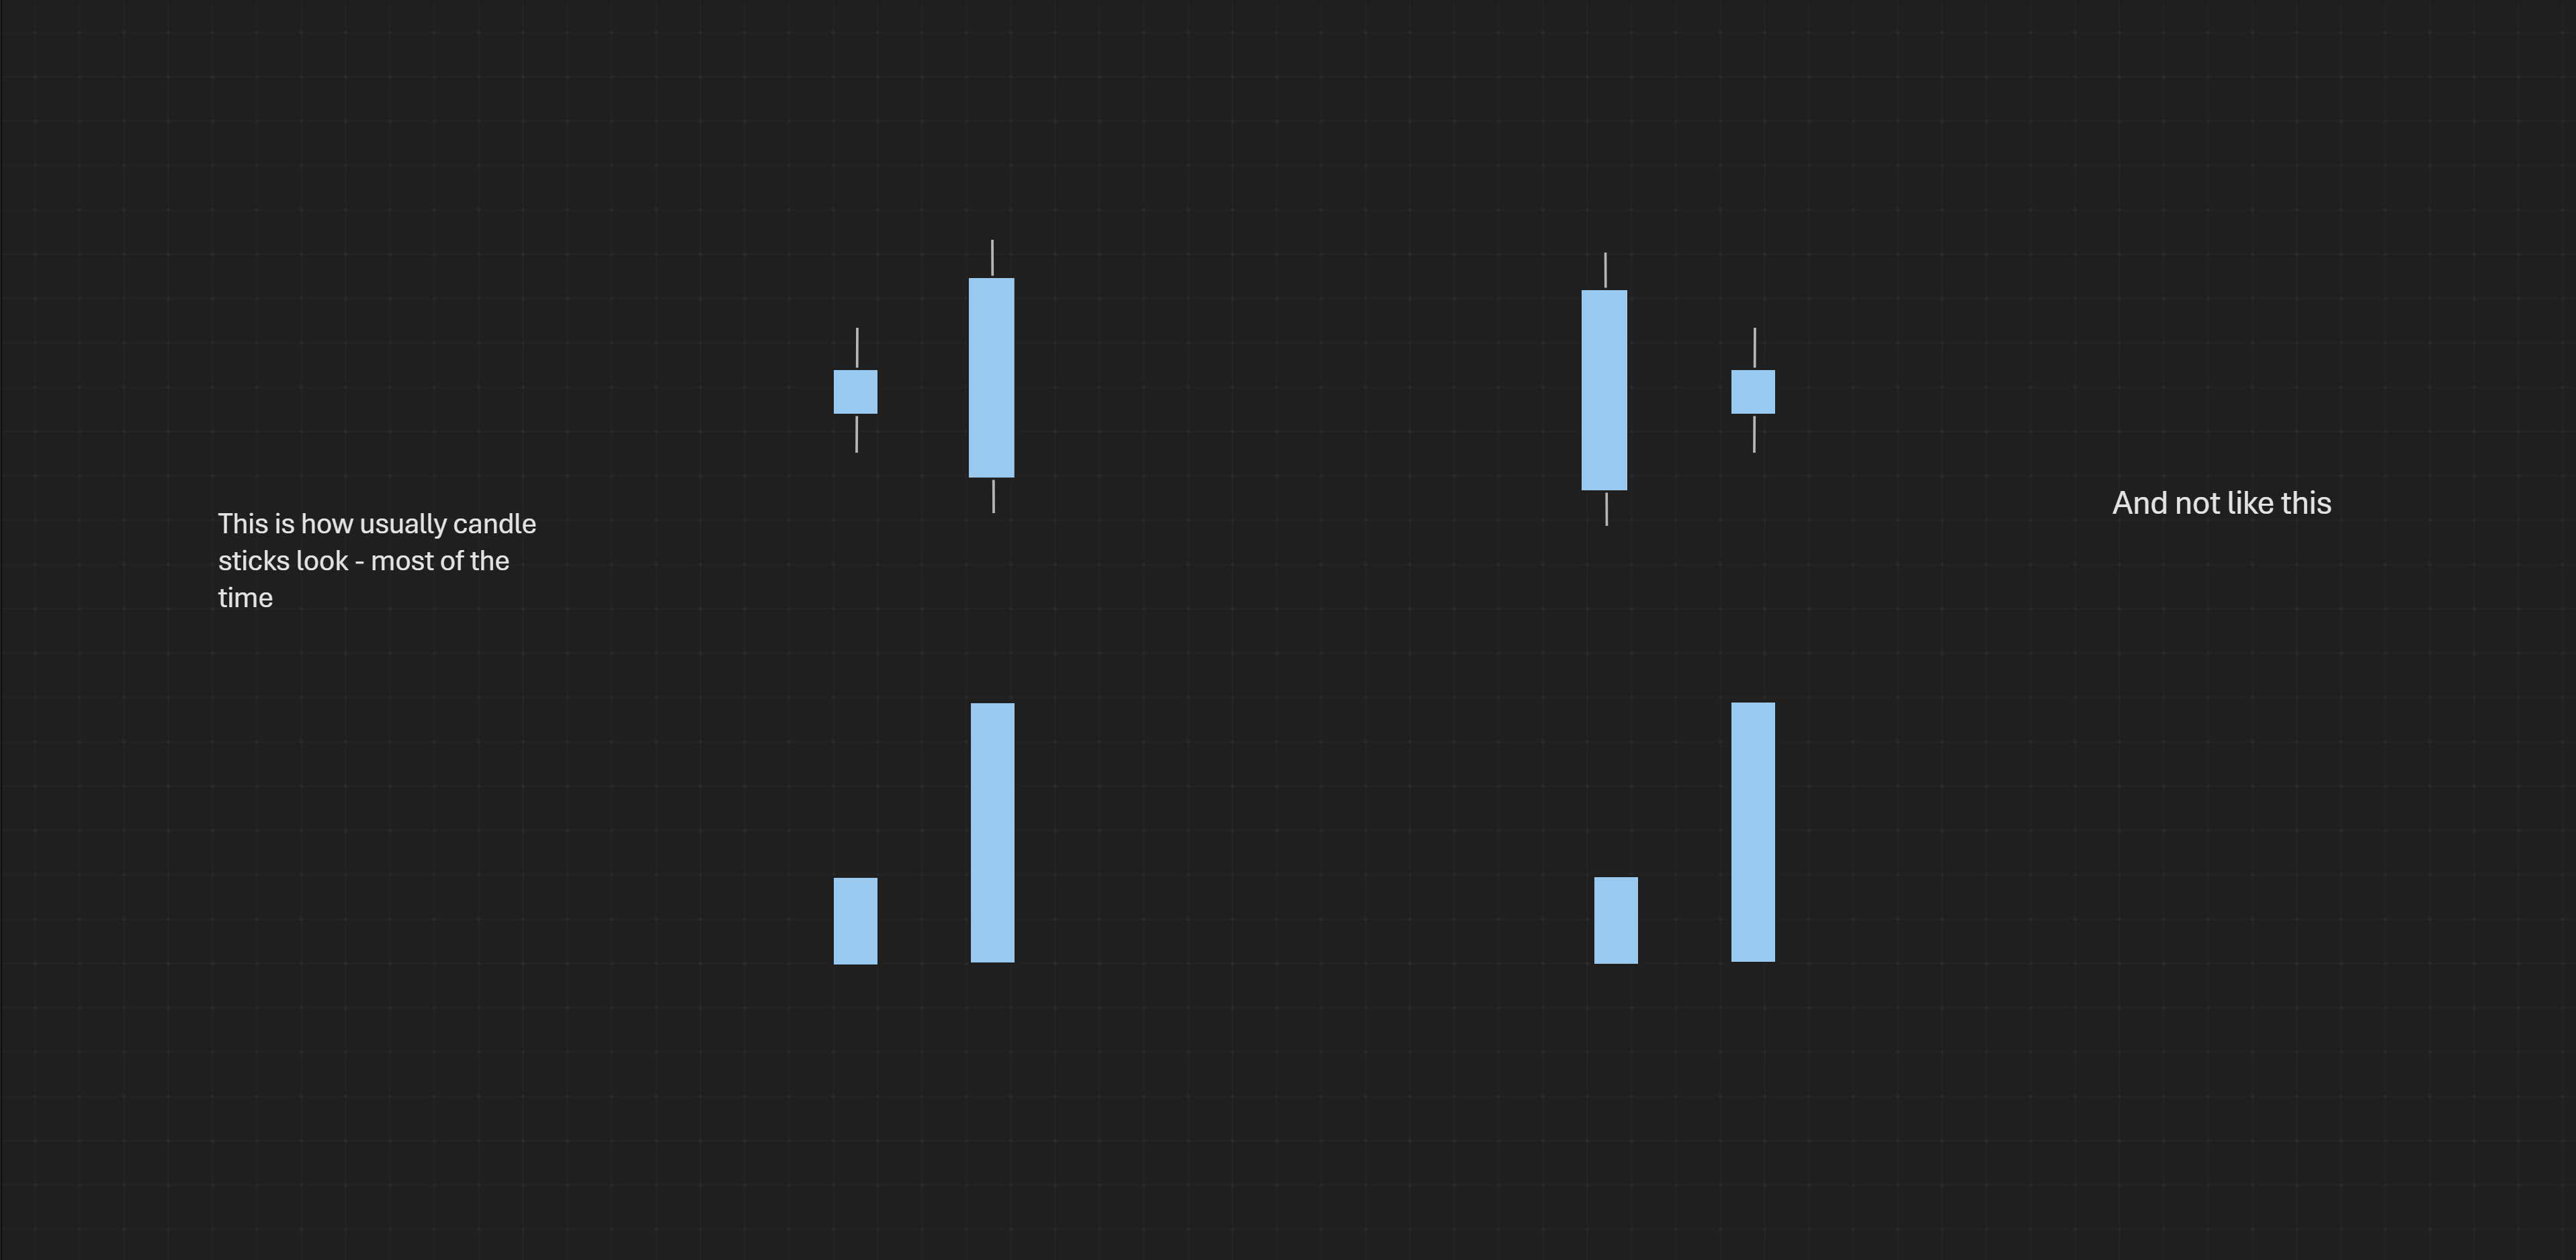
As per image if you see buyers’ strength and sellers’ exhaustion that same thing is reflected in price if not all the time most of the time let's say 99%. Ask yourself, visually can a stock with 10% plus day or let's just say relatively big bar (range expansion), can it happen with relatively small volume bar? Answer is NO right. Similarly, if any specific day range is narrow so called small, tiny bar can that day have very big volume bar relatively? Answers is NO right. So as per the observation or let’s say my take is visually volume bar size is directly dependent of size of the price bar (candlestick size). So, if I can gauge buyers’ strength and sellers’ exhaustion seeing stock candlesticks that is just seeing price charts then why waste time seeing volume bar. I seriously don't care, and it doesn't make sense. And if at all there will be a big volume bar and narrow range candlestick and if there is small volume bar and big range candlestick then that means it's an outlier and, in this universe, there are always outliers, hence it doesn't matter to me at all.
At this point seeing below two images you will agree, I hope. If not, show me 3 examples where visually the volume bar is big and its price candlestick bar is small and vice versa.
Now people have fancy volume indicators showing the highest volume ever or in the last quarter highest volume or even let’s say actual volume number like 2L shares or 5L shares traded. All this is useless. Why does it matter if its highest ever or highest in quarter it doesn't help in anyway and its miss leading, for example if stock trading at 1000 Rs and average volume is 10 shares so on an average, VP is 10k right. Now the same stock undergo split and now stock price is 200rs and VP today also its 10k then volume number is 50 rights. Suddenly this VP looks big, and this can be the highest in a quarter or something, because when comparing just shares then this seems a relatively big number hence its misleading. Below BSE is the example. And moreover, knowing this never resulted in me making money so why to see in first place.
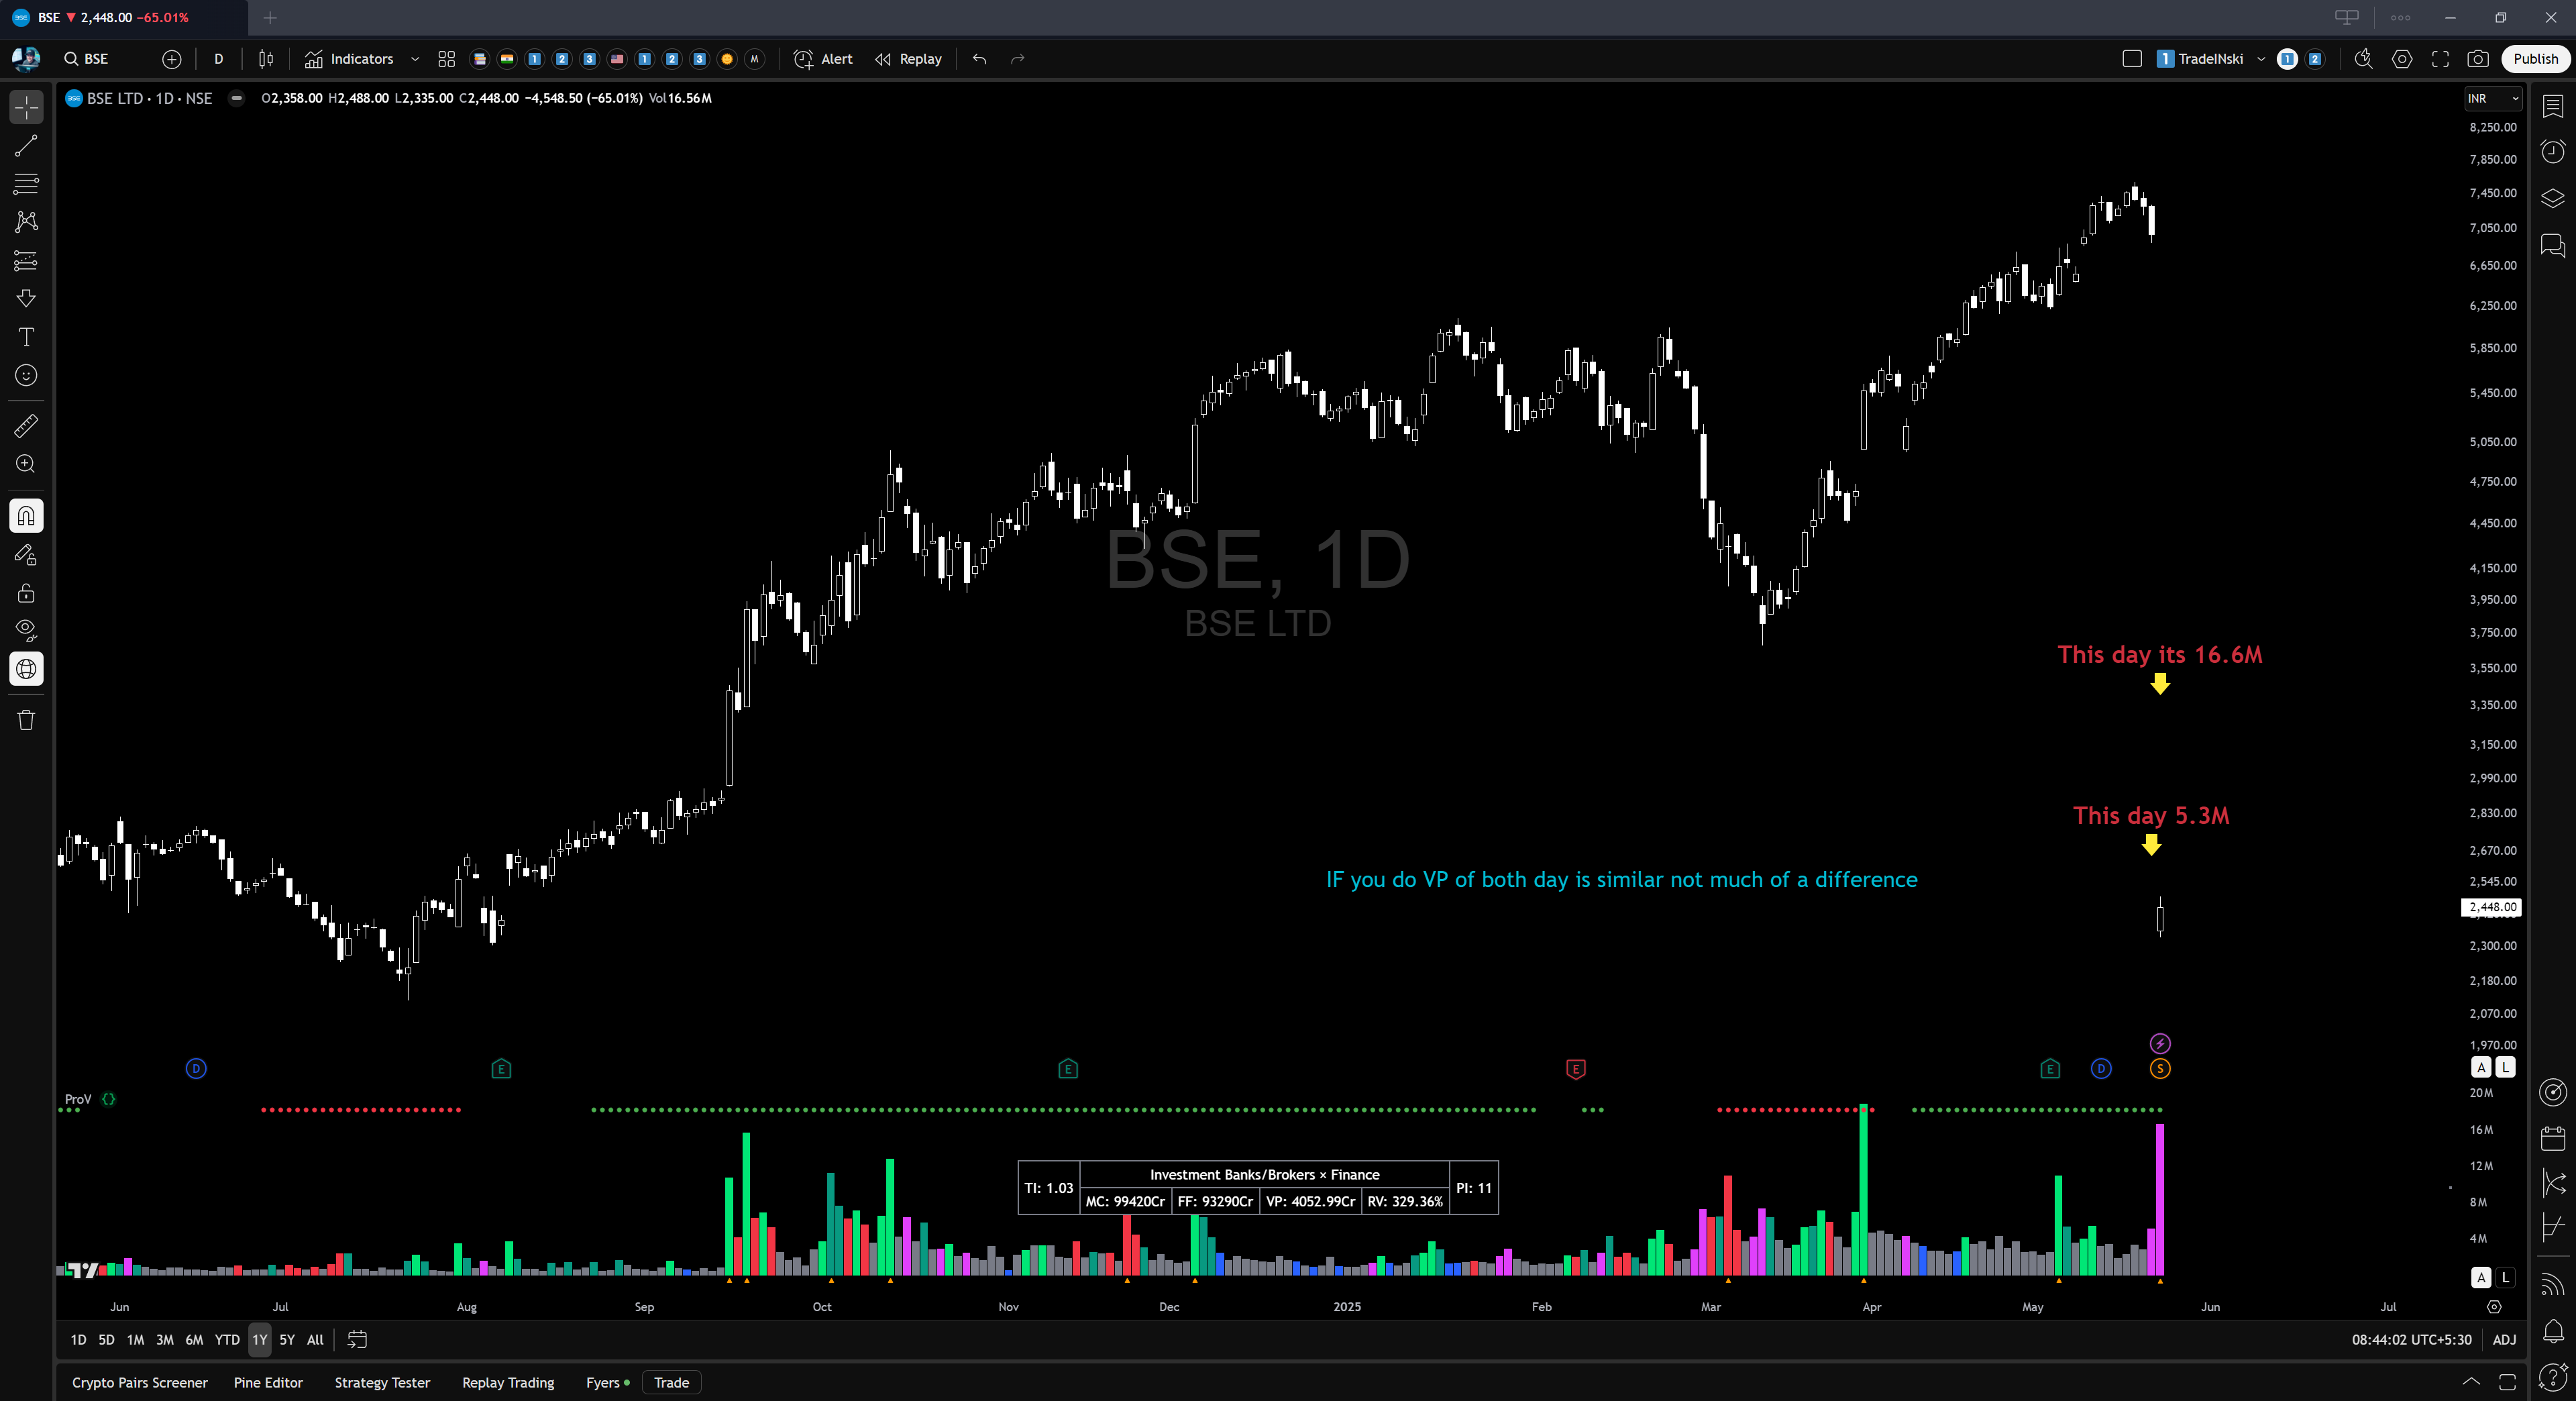
And coming to numbers it doesn't not matter because usually again it's linked to the price of the stock. For example, generally you cannot expect 1L Rs price stock to trade in lakhs and expect 100 Rs stock trade in thousands considering our market liquidity, so again it's mostly a by-product of price.
Now coming to the concept of bull snort which got famous by Oliver Kell. He considers if today volume is 3 times the average volume, then its bull snort. Which again it absolutely doesn't make sense to me because 3 times or 5 times or something times, what does it matter. This is like saying EMA 20 is better than EMA 21. Nonsense. This is subjective and not a thing to quantify. Hence if at all you see a big volume bar relatively, it's good else it's okay. Trying to quantify it, doesn't make sense.
And even RVOL concept is flawed more on this in next blogs and just seeing volume bars in first place is also flawed because volume in low float stocks is different from high float stocks that is small cap and large cap. These 2 concepts will be discussed in part 2 of this blog.
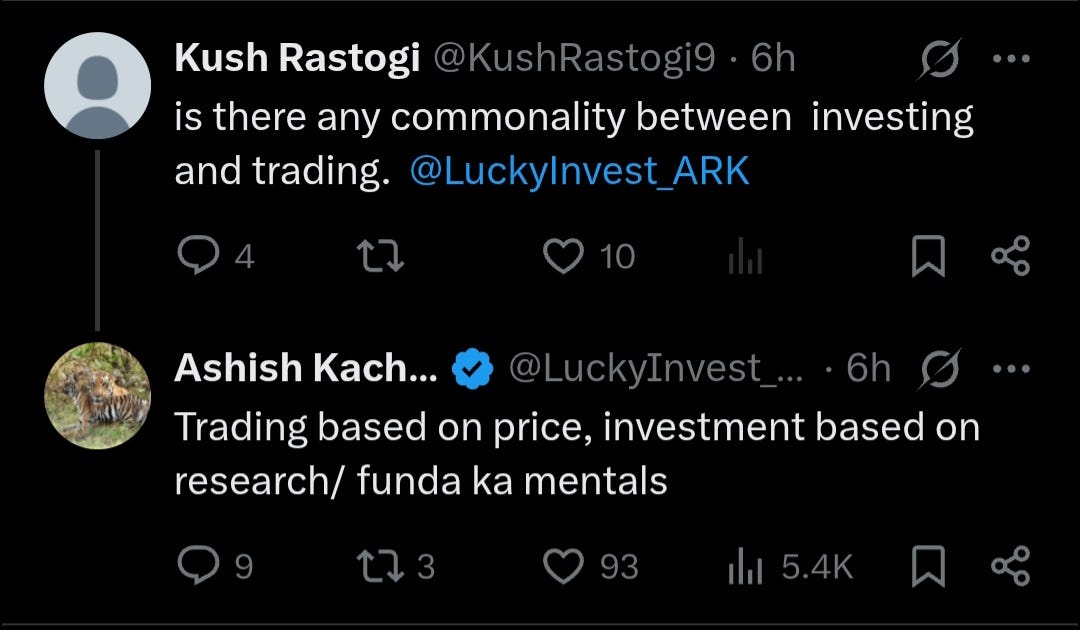
Finally, what a renowned investor Ashish Kacholia to say about trading. Do you think he forgot to mention volume or is he trying to say volume is useless less?
Summary,
I use volume for liquidity only that is VP volume * price. Above 20 Cr.
Whatever you are trying to see in volume bars the same thing can be seen in price candlestick also but your brainwashed to see in volume indicator.
Visually most of the time, if not all the time, the size of the candlestick (range) matches with size of the volume. That is a big price bar - big volume bar and vice-versa is also true. But there will be some outliers.
Using or seeing the highest volume ever or quarter or something and seeing volume and comparing numbers is useless.
Generally, volume number that is shares traded is dependent on price of the stock irrespective of liquidity.
Instead of quantifying big volume bars as bull snort or something else is useless. If you just say big bars that's enough by how much does not matter.
And what about CD?? In that also we don't need to rely on vol indicator??
Sir if we see any outlier,then in such case we might get Confused 🤔 so what to do in such situation??